


Excel Reporting Tools: One Dashboard or Many Files? A Decision Guide

It is the last Tuesday of the month, and the master workbook is open again. Filter to the first client. Copy. Paste into a fresh workbook. Type the filename, check the month, attach, send. Repeat 30 times, and hope the filter from client 14 was not still active when you saved client 15.
Search for an “Excel reporting tool” to fix this and you get dashboards: BI platforms, connectors, live charts. Useful products, solving a different problem than the one on your screen. That is because two different jobs hide behind the same search. Consolidation reporting pulls many data sources into one live view. Distribution reporting turns one master workbook into a personalized file for each client, region, employee, or property. Tools that generate one report file per row exist; the dashboard listicles just never mention them.
This guide is a map of both sides: a three-question decision filter, six tool classes compared (including when not to use MailMergic), a walkthrough of the underserved distribution side, what actually survives automated generation, and a pre-send checklist you can use with any tool.
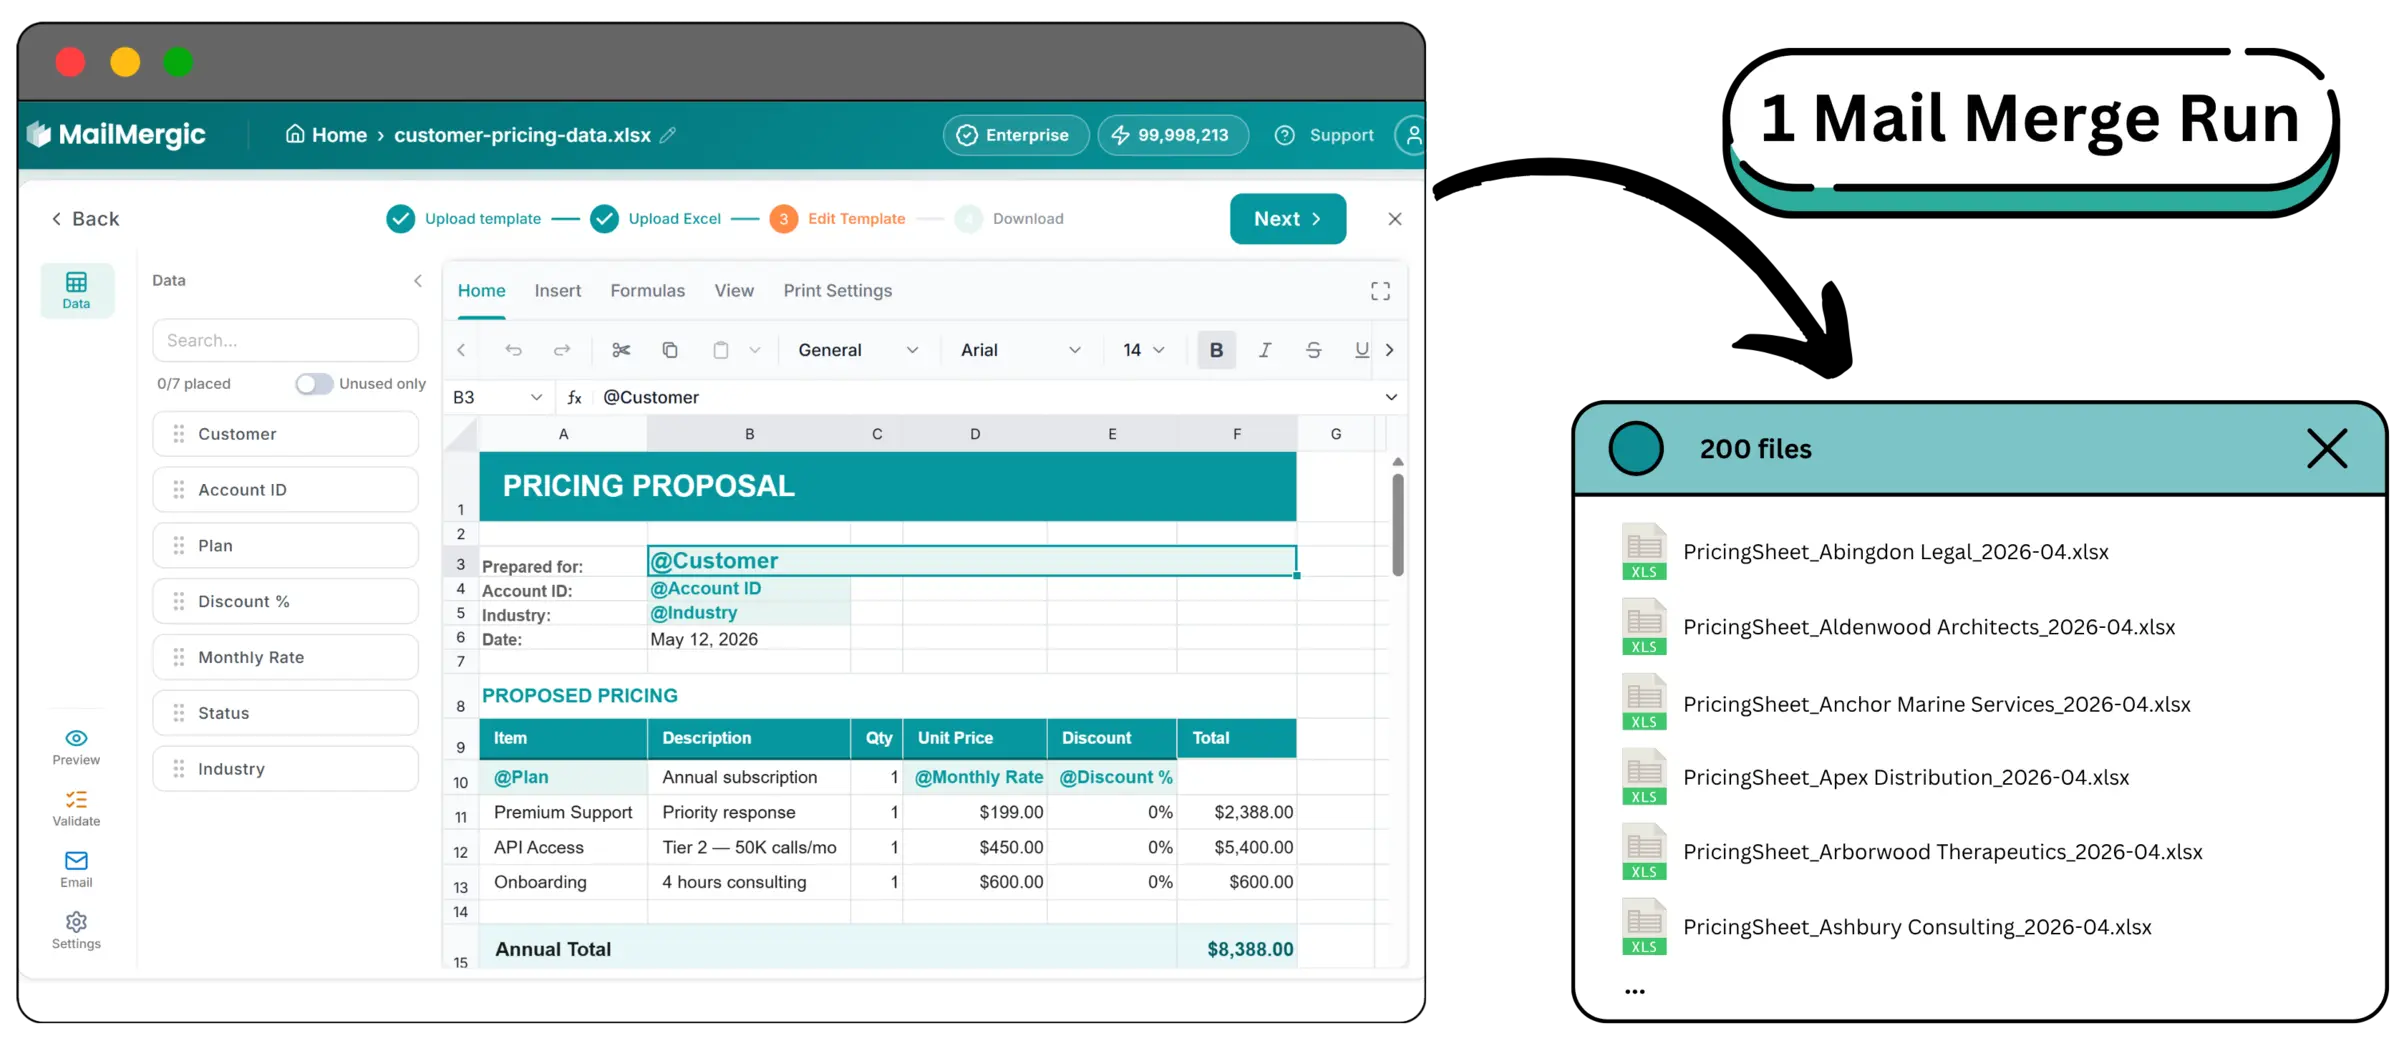
Table of contents
- Two different jobs hide behind one search
- Five properties only a file has
- What the manual loop actually costs
- The decision guide: three questions, six tool classes
- Setting up automated report generation, step by step
- What survives automated generation (and what to test)
- Distribution reporting by team: four recurring reports
- The pre-send checklist for per-stakeholder reports
- Frequently asked questions
- Pick the job first, then the tool
Two different jobs hide behind one search
Every list of top Excel reporting tools answers one question: how do I get my data into one polished view? A large share of the people typing that search need the opposite: one personalized file in each stakeholder’s inbox, every month, without doing it by hand. Neither camp acknowledges the other exists.
One rule of thumb settles most of the confusion.
Consolidation is pull reporting: the stakeholder comes to the data. Distribution is push reporting: the data goes to the stakeholder. A view means a pull job. A file per stakeholder means a push job.
If you have a push job, most of the tools on the first page of results will not help you.
Consolidation: many sources, one view
Consolidation reporting combines data from multiple sources into a single dataset or live dashboard that refreshes on its own. The audience comes to the report: they log in, look at the numbers, maybe drill down.
Live operational monitoring, shared team KPIs, and exploratory analysis belong in a dashboard, and this article is not going to talk you out of one. The signals that you have a consolidation job: your pain is assembling inputs (twelve monthly CSVs, three systems that disagree), everyone is allowed to see the same numbers, and nothing needs to leave the building addressed to a specific recipient.
If that is your situation, Power Query covers the Excel side of it well. The foundation guide explains how the input side and the output side of a reporting pipeline differ, and the dedicated Power Query comparison maps the boundary in detail.
Distribution: one master, many personalized files
Distribution reporting starts from one master workbook and produces many report files: one per client, region, employee, or property, regenerated monthly or weekly, usually delivered as an email attachment.
This job is real, but it has no shelf in the tool aisle. The people who have it ask forums how to “create multiple reports from one sheet,” how to get “a separate file for each row,” how to “automate a report for each client,” and they get decade-old VBA snippets as answers. Enterprise BI does have a name for it: report bursting. But every documented bursting setup assumes a BI server underneath, and usually a paid edition or add-on on top. There is no first-class answer for the person whose template and data both already live in Excel.
There is also a quiet tell that push reporting never went away: on plenty of dashboards, the most-used button is “Export to Excel,” and at the end of every month someone senior still asks for “the file.” The friction chain explains why. Log in, find the right dashboard, wait for it to load, filter to your slice, then export it to Excel anyway. An attachment in the inbox is open in five seconds. Wanting a file in the stakeholder’s inbox is a legitimate requirement, not a change-management failure.
Five properties only a file has
Choosing file-based reporting is not nostalgia. A generated report file has properties a dashboard cannot have, and for some reports those properties are the requirement.
- Editable. The recipient can annotate, extend, and model on top of the numbers. A regional VP testing a what-if adds a column. A dashboard is read-only by design.
- Offline and portable. A file opens on a plane, can be forwarded to an auditor, and needs no seat license or account provisioning. The report outlives the tool that made it.
- Archivable. A dashboard always shows today’s truth, which is the wrong truth for “what did we report in March?” A generated file is a frozen snapshot at close.
- Formula-transparent. The recipient can click the total and read the SUMIFS behind it. A dashboard asks to be believed. A workbook can be checked.
- Scoped by construction. A file generated from one row contains only that recipient’s data, because it was built from nothing else. Filtering or hiding is not redaction: a hidden tab unhides in two clicks. In 2023 the Police Service of Northern Ireland answered a freedom of information request with a workbook whose hidden worksheet held personal data on 9,483 officers and staff, and the UK Information Commissioner’s Office later fined it 750,000 pounds.
That last property is the strongest argument that push reporting deserves a real tool. Commission statements, payroll summaries, and per-manager data cannot ship as one master file with a filter applied. Confidentiality, not tidiness, forces the one-file-per-person pattern.

What the manual loop actually costs
The arithmetic of the manual loop is easy to check against your own calendar. Each pass is 20 to 30 minutes once you count filtering, copying, reformatting, saving, naming, attaching, and double-checking. Multiply by the number of recipients and by twelve months, and the loop quietly becomes a full working week per year for even a modest reporting pack.
| Reporting pack | Manual loop | First build | Every re-run after |
|---|---|---|---|
| 12 regional sales packs, monthly | 3 to 5 hours | 1 to 2 hours to turn the layout into a template, then a 5-minute run | About a minute |
| 30 client reports, monthly | 10 to 15 hours at 20 to 30 minutes each | 2 to 3 hours including a test run | About a minute, plus review |
| 200 employee summaries, quarterly | 60 to 100 hours of save-as | 2 to 4 hours including a small pilot batch | A few minutes |
The hours are only half the cost. The other half is the error surface: the filter left on from the previous client, the stale pivot nobody refreshed, the hand-typed filename carrying last month’s date, the attachment picker showing five near-identical FINAL_v2 files, the sheet you forgot to re-hide. Each output is one more chance to send the wrong numbers to the wrong person.
There is also a hidden sub-chore. Workbooks assembled by copy-paste often still reference files on your drive, so recipients get greeted by an update-links prompt and #REF! errors. The pre-send ritual becomes break links, paste values, re-check, for every single file, and forgetting one step is a perennial support-forum complaint.
One honest caveat, so the table above does not oversell: the first month is not a minute. Turning a manually assembled layout into a template is an hour or two of real work. Every month after that is where the arithmetic flips. The guide below routes you to the class of tool that ends this loop for your specific job.
The decision guide: three questions, six tool classes
This section exists so you spend ten minutes choosing instead of two weeks trialing. It will route you away from MailMergic where something else is the right answer.
Three questions that settle it
- Is the deliverable one view or many files? One view routes you to consolidation tools: Power Query for combining data, a BI platform for live dashboards. Many files routes you to distribution tools: scripts, workflow platforms, or template-based file generators.
- Does each recipient need a real spreadsheet or a picture of the data? If recipients need formulas they can trace and cells they can keep working in, the field narrows sharply, because most automation paths output flat value dumps or PDFs.
- Who maintains this when you are on vacation, or gone? Code concentrates knowledge in one person; the 5,000-line macro whose author retired is a genre, not an anecdote. The macro replacement guide covers the single-maintainer problem in depth. Managed tools and built-in features survive handoffs; scripts often do not.
Your three answers place you in one row of the table below.
The six tool classes compared
| Tool class | Built for | Output | Skill needed | Time to first report | Where it breaks |
|---|---|---|---|---|---|
| Excel alone (PivotTables, manual save-as) | Small-scale analysis, one-off reports | One workbook, or hand-made copies | Basic Excel | Minutes | Effort grows linearly with stakeholders; every file risks a leftover filter or typo |
| Power Query | Combining sources into one refreshed workbook | One consolidated workbook | Intermediate Excel | An afternoon | It cannot split one workbook into many files; it is the input side of the pipeline |
| BI dashboards (Power BI, Tableau, and similar) | Live views, shared KPIs | Dashboards, PDF exports | Data modeling plus admin setup | Days to weeks | Per-viewer licensing and adoption; many stakeholders export to Excel anyway |
| Scripts (VBA, Python, Office Scripts) | Fully custom distribution | Whatever you code, often value-only dumps | Programming | Days, plus permanent maintenance | The single-maintainer problem; IT policies increasingly block macro files |
| Workflow and RPA platforms (Power Automate and similar) | Enterprise pipelines on a schedule | Files dropped into mail or SharePoint | Flow building plus admin rights | Days | Can fail quietly: an expired connection or suspended flow goes unnoticed until a report never arrives |
| Template-based file generation (template sheet plus data sheet, one file per row) | Distribution when template and data live in Excel | One personalized .xlsx or PDF per row | Excel only | About 5 minutes | Batch only, no event triggers; 25 MB per file, 100,000 rows per run; macros are stripped |
When something other than the last row fits, use it. Dashboards are right when stakeholders will genuinely log in and licensing exists. Power Query is right when the job is combining twelve CSVs into one workbook. Scripts are right when you need cross-application automation beyond file generation; the macro replacement guide has a fair list of macros worth keeping. Workflow platforms are right when files must land in SharePoint on a timer and someone owns monitoring the flow. And when the output is fundamentally prose, letters or contracts rather than tables, Word mail merge is the right mechanism.
The last row is the class MailMergic belongs to. The mechanism behind it is Excel to Excel mail merge, and the complete guide covers it end to end. Its limits are in the table on purpose: it is batch-only, it will not react to events or run unattended, and it strips macros on upload. If your reporting pack fits inside those limits, it is the shortest path from a master workbook to a folder of personalized files: about five minutes to a first run, against days to weeks for the other distribution rows in the table.
Setting up automated report generation, step by step
Here is the distribution-side setup, using a concrete pack: a monthly regional sales report, twelve rows for twelve regions, with columns region_name, manager_name, manager_email, total_revenue, target, yoy_growth, and top_product.
Start from one workbook. The report layout lives on one sheet, the data on another, one row per region. Data can also come from a separate file (.xlsx, .xlsm, .xls, .xlsb, .csv, .txt, .ods) or a Google Sheet via OAuth, imported as a snapshot at connect time (reselect the sheet to refresh it). Header detection scans the first 15 rows and shows a “Change” link if it guessed your header row wrong.
Mark the variable cells. Type @ in any template cell and a filtered picker of your column names opens. @region_name in the title cell, @total_revenue in the summary block. Whole-cell placeholders accept spaces in column names; placeholders inline with other text need names without spaces, which is why the example columns use underscores.
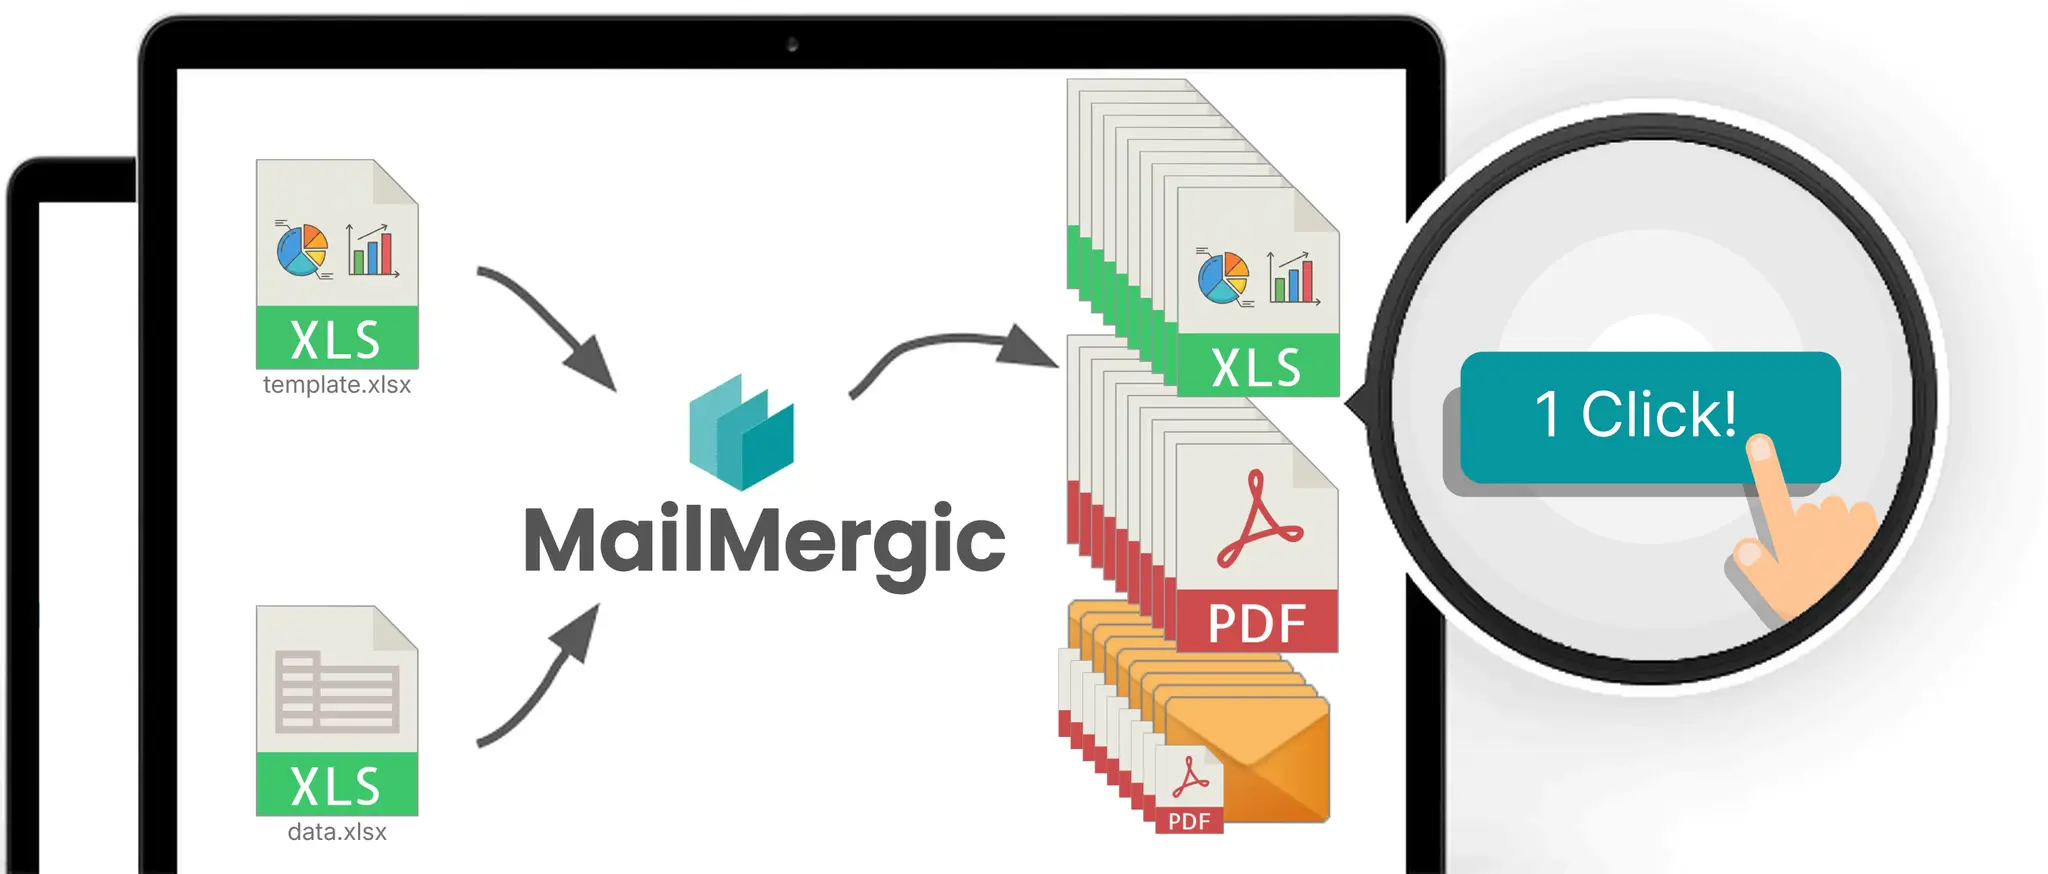
Scope the output. Right-click a sheet tab to exclude lookup sheets, scratch sheets, and the data sheet itself from the output. The Print Settings ribbon tab sets print area, orientation, and paper size per sheet, so the PDF version prints the way the template intends.
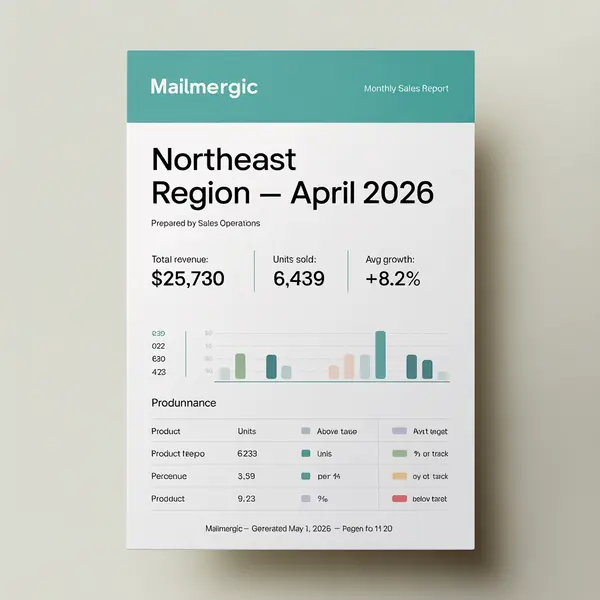
Preview the hard rows before generating. The floating “Row N of M” pill at the bottom of the editor steps through your data and shows each region’s finished file live. Do not preview only row 1. Step to the region with zero sales, the longest region name, and the one negative growth number; those are the rows that break layouts and thresholds. Then run a one-row test before the full batch.
Generate. Set a filename pattern from your columns, Sales_Report_@region_name.xlsx, and run the mail merge; the batch downloads as a ZIP. Choose .xlsx when recipients keep working with the numbers, since formulas stay live, or PDF when the file is final. PDF output supports an optional password and can combine all records into a single file; .xlsx is always one file per row.
Deliver (optional). Pick the manager_email column, write a subject and body with merge fields, and one click sends each manager their own file. Delivery, opens, and bounces land in a dashboard, which answers a question the split-workbook tutorials never touch: did the March pack actually reach the new regional manager? Sending from your own domain is a paid-plan feature; details are on the pricing page.
First run, about five minutes. Every month after: update the data sheet, re-run, about a minute. The free plan’s monthly credits (one credit per row generated) cover a real test of your own pack. Files are processed in EU data centers and encrypted in transit and at rest; MailMergic is GDPR and CCPA compliant, and retention is configurable from 1 to 180 days. Specifics are on the privacy page. For the full step-by-step of every wizard screen, see the complete guide.
What survives automated generation (and what to test)
No ranking page on any of these searches tells you what survives automated generation, and most scripting tutorials silently produce flat value dumps: the numbers arrive, the logic and formatting do not. Be skeptical of any tool that does not spell this out.
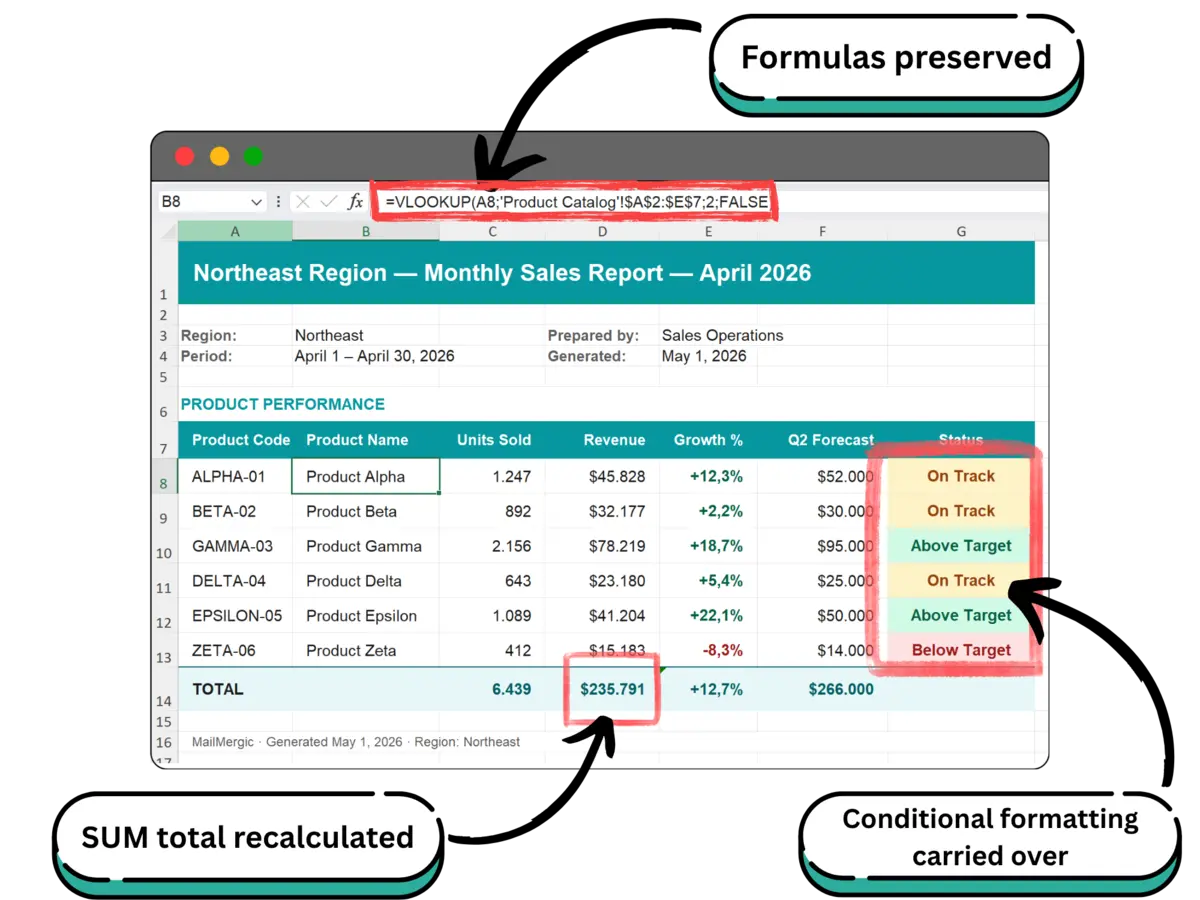
Survives and recalculates. SUM, VLOOKUP, IF, INDEX/MATCH, SUMIFS, COUNTIFS, and the standard date, text, and financial functions are preserved and recalculated after each row’s data is substituted. Also preserved: conditional formatting (color scales, data bars, icon sets), named ranges, cell styles and number formats, print areas, multi-sheet structure, and per-sheet page setup. The full preservation list with examples is in the foundation guide.
Stripped. VBA macros are removed on upload for security. An .xlsm keeps its extension, but the code comes out empty. Most teams adopting template-based generation are retiring macro workflows anyway; if yours depends on macro calculations, move that logic into formulas first.
May break. Unrecognized or proprietary functions render as #NAME? or #VALUE! errors. Circular references fall back to 0 unless iterative calculation is enabled. Array formulas, external file references, and very large pivot tables are edge cases. The one-row test from the walkthrough answers all of these in about a minute.
Because the template and data live in one self-contained workbook, generated files carry no references to files on your drive. Recipients never see the update-links prompt, and the break-links ritual disappears. The formula preservation deep dive covers the full territory.
Distribution reporting by team: four recurring reports
The same push-reporting shape appears in almost every department; only the nouns change.
- Sales operations. A master pricing workbook becomes 47 per-customer pricing sheets in one run, each customer seeing only their own discounts. Quote turnaround drops from a day to a minute. The complete build walks the whole factory.
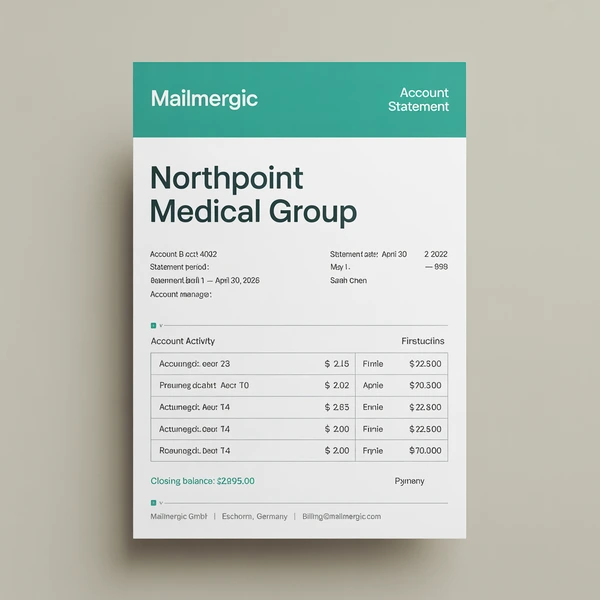
- Finance. Six regional month-end packs; once the template exists, the half-day assembly becomes a 10-minute data update and a one-minute run. The finance walkthrough builds the full pack.
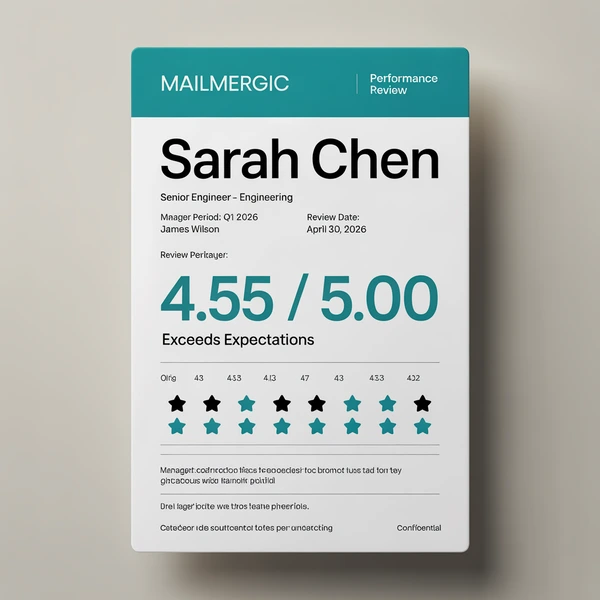
- HR. 200 per-employee performance summaries, each scoped to a single row by construction. The wrong-attachment mistake, the one HR error nobody recovers from, disappears because no file ever contained anyone else’s data. The HR walkthrough builds the full cycle.
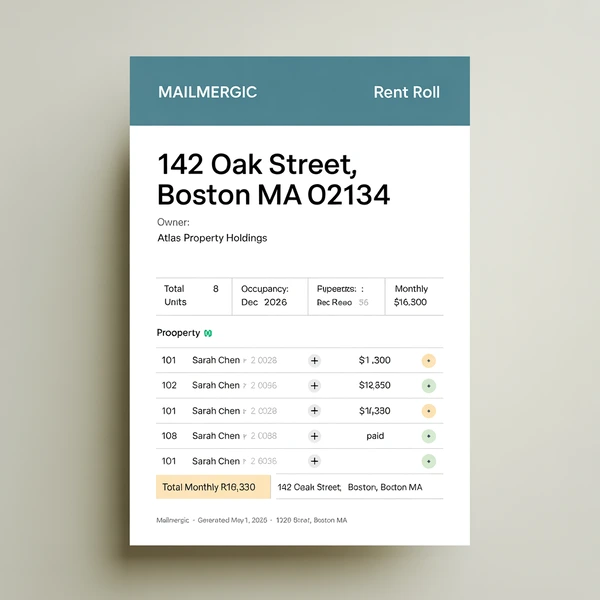
- Property management. One rent roll per property per month across 30 or 300 properties, with the paid, pending, and overdue color coding intact. The rent roll walkthrough builds the full portfolio cycle.
The foundation guide covers all four in detail, and each vignette above links its dedicated walkthrough.
The pre-send checklist for per-stakeholder reports
Run this before any batch of per-stakeholder files leaves your machine, whatever tool produced them. Automated generation makes most items true by construction; a manual process has to verify each one, per file.
- Scope. The file contains only this recipient’s rows because it was built that way, not because a filter or hidden rows are concealing the rest.
- Hidden data. No hidden sheets, rows, or columns carrying the full dataset. If the file was assembled by hand, run Excel’s Document Inspector.
- Links. No external references to files on your drive. Break links and paste values, or generate self-contained files so there is nothing to break.
- Freshness. Pivots refreshed, formulas recalculated, period labels showing the right month.
- Filename. Built from data columns, never typed by hand.
- Address. The recipient address comes from a data column, not from the mail client’s autocomplete.
- Receipt. Delivery and bounce tracking, or at least a confirmation loop, so you find out about a silent failure before the stakeholder does.
Frequently asked questions
Q: Can Excel generate reports automatically without macros or VBA?
A: Not by itself; Excel has no built-in way to produce one file per row. But a no-code, template-based tool does it from any browser: mark cells with @columnName placeholders and generate one personalized file per data row, with no scripting anywhere. If you are replacing an existing macro, the macro replacement guide covers the migration.
Q: How do I create multiple reports from one sheet in Excel?
A: Put the report layout on one sheet and the data on another, one row per report. A template-based generator then produces one output file per row. This avoids the classic answer, a VBA loop, along with its maintenance burden.
Q: How do I generate a separate Excel file for each row of a spreadsheet?
A: This is exactly the one-file-per-row workflow: upload the workbook, mark placeholder cells, and generate. Each row becomes its own .xlsx or PDF, named from your columns, downloaded together as a ZIP.
Q: How do I automate a monthly report for each client separately?
A: Keep one master workbook with a template sheet and one data row per client. Each month, update the data, re-run, and optionally have each client’s file emailed to the address in their row. The re-run is about a minute.
Q: What is report bursting, and can I do it without Power BI or SSRS?
A: Report bursting is the enterprise name for splitting one report into personalized copies per recipient; SSRS does it with data-driven subscriptions. If your template and data already live in Excel, a template-plus-data workbook achieves the same outcome without a BI server or add-ons.
Q: How do I email each person only their own rows from a spreadsheet?
A: Generate one file per row, so each file is scoped to one person by construction, then use the email step to send each file to the address in its row. Delivery and bounces are tracked, so you know each report arrived.
Q: Do formulas and conditional formatting survive automated report generation?
A: With template-based generation, yes: standard functions recalculate after substitution, and conditional formatting, named ranges, and styles carry through. Script-built reports often ship values only. The complete guide lists exactly what survives.
Q: How do I stop the “update links” prompt and #REF! errors when I email a workbook?
A: Those come from references to files on your drive. Either break links and paste values before every send, or generate reports from a self-contained template-plus-data workbook so the output has no external references at all.
Q: Can I schedule my Excel reports to go out automatically every month?
A: There is no timer in MailMergic. Your configuration persists, so the monthly cycle is: update the data sheet, re-run in about a minute, and sending is one click. If a fully unattended schedule is a hard requirement, a workflow platform is the honest answer, monitoring burden included.
Q: What is the best tool for generating reports from Excel data?
A: It depends which job you have. If the deliverable is one live view, use Power Query and a BI platform. If it is one personalized file per stakeholder, use a template-based generator. The six-class table above maps the whole field.
Pick the job first, then the tool
If the deliverable is a view, you need a consolidation tool, and the table above points you to good ones. If the deliverable is a file per stakeholder, the loop you run every month is a solved problem: one template, one data sheet, one run.
The first run takes about five minutes on the free plan with your own workbook. That is less time than one pass through the manual loop for a single client.
Generate your reports from Excel →
New to the series? Start with Excel to Excel Mail Merge: The Complete Guide for the full walkthrough, or Excel Automation Without VBA if you are replacing macros. The role-specific walkthroughs are linked from the article above, and the Power Query comparison maps the input side of the pipeline.