
The Month-End Reporting Pack: One Workbook, Twelve Regional Reports

The pack goes out on working day five. Within the hour, the Northeast VP replies to the PDF: can you send the actual workbook, I want to see what is under the freight number. A reasonable ask, from the person accountable for that freight number.
From the controller’s side of the desk it looks different. The workbook that computes Northeast’s P&L also holds the other eleven regions’ GL rows. Sending it to twelve inboxes is not a formatting decision. It is a disclosure decision.
That is the fight: drill-down and scoping pull in opposite directions inside a single file, and every finance team refights it monthly. This article resolves it per audience instead of once for everyone, and builds the full twelve-region pack around that answer: one finished pack per region from one workbook, a region key driving every SUMIFS, an actual vs budget vs prior year variance block whose threshold flags survive generation, three sheets per region, delivery with receipts, and a close week checklist. The pack is what stands between you and the end of close week.
Free workbook
month-end-reporting-pack-template.xlsx
The complete pack from this article: all five sheets, the twelve-region extract, the region key, and the variance block already wired. No signup.
Table of contents
- The fight over the file: drill down or stay scoped
- One workbook, twelve regional packs
- The region key: one cell rebuilds the pack for every region
- Preview the regions that break the pack
- Who gets the workbook, who gets the PDF
- Out the door by working day five
- The close week checklist
- Frequently asked questions
- One close, twelve packs, one run
The fight over the file: drill down or stay scoped
The VP’s case is the legitimate case for files. A workbook is editable and formula-transparent: a number you can interrogate instead of believe. That argument is made in full in five properties only a file has.
The controller’s case is equally legitimate. A hidden sheet unhides in two clicks. A filter is not redaction. The consolidated extract holds every region, so for numbers that peers should not see, scoping by construction, not concealment, is the only defensible posture.
The failure modes are not hypothetical: the pack email with the consolidated workbook still sitting below the PDF, or the entity P&L forwarded one level down with every other entity one unhide away. Both take one hurried send on working day five.
The mistake both sides make is answering the format question once, for all twelve recipients. The build below answers it per audience, and the rule lands in full in Who gets the workbook, who gets the PDF.
Arriving from the reporting hub? The decision guide compressed this exact twelve-region pack into a short walkthrough. This article is the full build: schema, formulas, thresholds, the format call, and the calendar fit.
One workbook, twelve regional packs
The pack is one workbook with five sheets.
Data is the GL extract: one row per region per P&L line, columns region, line_item, actual, budget, prior_year (A through E). Call it 12 regions times 25 lines, about 300 rows, pasted in fresh each close. Costs are stored as negatives; that convention pays off in the variance block below.
Regions is the row source: 12 rows, one per region, and one generated pack per row.
Summary, P&L, and Commentary are the three template sheets the recipient sees. A three-sheet template produces a three-sheet output per row.
The direction flip from the compressed version is worth naming. The decision guide’s walkthrough carried total_revenue and yoy_growth in the row itself, which works for a one-sheet report. The full pack inverts it: the row carries the key and the routing, and the template pulls every number from Data. The extract can change row count every month without the template changing shape. Nothing is ever pasted into the template.
| Column | Example | Where it lands |
|---|---|---|
region_code |
PNW | Filename |
region_name |
Pacific Northwest | Key cell B2, cover title, filename |
period |
2026-07 | Cover title and filename |
manager_name |
Dana Okafor | Cover greeting |
manager_email |
d.okafor@example.com | Email recipient |
commentary |
Freight 14% over budget; carrier renegotiation lands in August (owner: J. Alvarez) | Whole-cell placeholder on the Commentary sheet |
Underscore names keep the fields usable inline in generated files; whole-cell placeholders accept spaces if you prefer them, and they are the kind the editor’s live preview resolves, so give any field you want to watch its own cell.
The commentary column deserves a sentence, because it changes how the narrative gets written. The conventional rule is that every material variance gets one written line with a driver and an owner. As a data column, that becomes twelve cells in one column on one screen, written in one sitting while the variances are fresh, instead of twelve files opened one at a time.
The pack contents themselves follow convention: a headline scorecard of 3 to 7 metrics, the P&L with budget vs actual variance, and written commentary. UK readers know this artifact as management accounts, or the MI pack.
Download this build. month-end-reporting-pack-template.xlsx is the pack this article builds: all five sheets, the twelve-region extract with the hard cases in place, the region key, the variance block, and the tripwire already wired. Free, no signup. A run reads a single sheet as its data source, so the file ships with Regions first: upload it unchanged and that is already the sheet it merges from. Paste your own extract into Data when you are ready; the templates do not change.
The mechanism underneath is Excel to Excel mail merge; the complete guide walks every wizard screen, so this article stays on the finance-specific parts. Assembling the extract from the ERP export is input-side work, and the dedicated Power Query comparison walks that side of the pipeline. The Regions row source can also live in a separate file (.xlsx, .csv, .ods, among others) or a Google Sheet via OAuth, imported as a snapshot at connect time; reselect to refresh. Header detection scans the first 15 rows and shows a “Change” banner if it guessed wrong. All of that is routing. The number-pulling runs through one cell on the P&L sheet, and that cell is next.
The region key: one cell rebuilds the pack for every region
The whole template hangs on one cell. B2 on the P&L sheet holds the placeholder @region_name. Every SUMIFS criterion references $B$2. At generation, each Regions row’s value substitutes into B2, and the formulas recalculate. Twelve rows in, twelve recalculated packs out.
You have probably met the incumbents. The pivot trick (Show Report Filter Pages) makes twelve sheets inside the same workbook, and the pivot cache travels with them. Filter, copy, paste, save-as breaks the month the row count changes. The macro version is a 240-line story told in the no-VBA guide’s workflow 2. The region key replaces all three with a template that never changes shape: only the key changes per output, and only the Data sheet changes per month.
Pull, not paste: SUMIFS against the region key
Each P&L line pulls its own actuals:
=SUMIFS(Data!$C$2:$C$400, Data!$A$2:$A$400, $B$2, Data!$B$2:$B$400, $A12)
A12 holds the line label (Product revenue, Freight, Payroll). Budget and prior year are the same formula against Data columns D and E. Reference discipline: $B$2 absolute, because every line keys on the same region; $A12 relative by row, so each line pulls its own label; ranges generous at $2:$400, so a growing extract never falls off the end.
The labels are the join, twice over. The extract’s region column must match region_name exactly, or every SUMIFS in that pack goes quietly to zero; the tripwire in the preview section catches that case, counting 0 instead of 25. Template line labels must match the extract’s line_item spelling just as exactly, and that mismatch is a silent zero on one line that no check cell flags, which is why the preview steps real regions line by line.
Two smaller payoffs. The no-sales month, which needed custom logic in the macro version, is just SUMIFS returning 0 here; no special case, no code. And before any row is substituted, B2 contains the literal text @region_name, so the SUMIFS legitimately return 0 in the editor. Step into the floating “Row N of M” preview and they resolve per region, row by row.
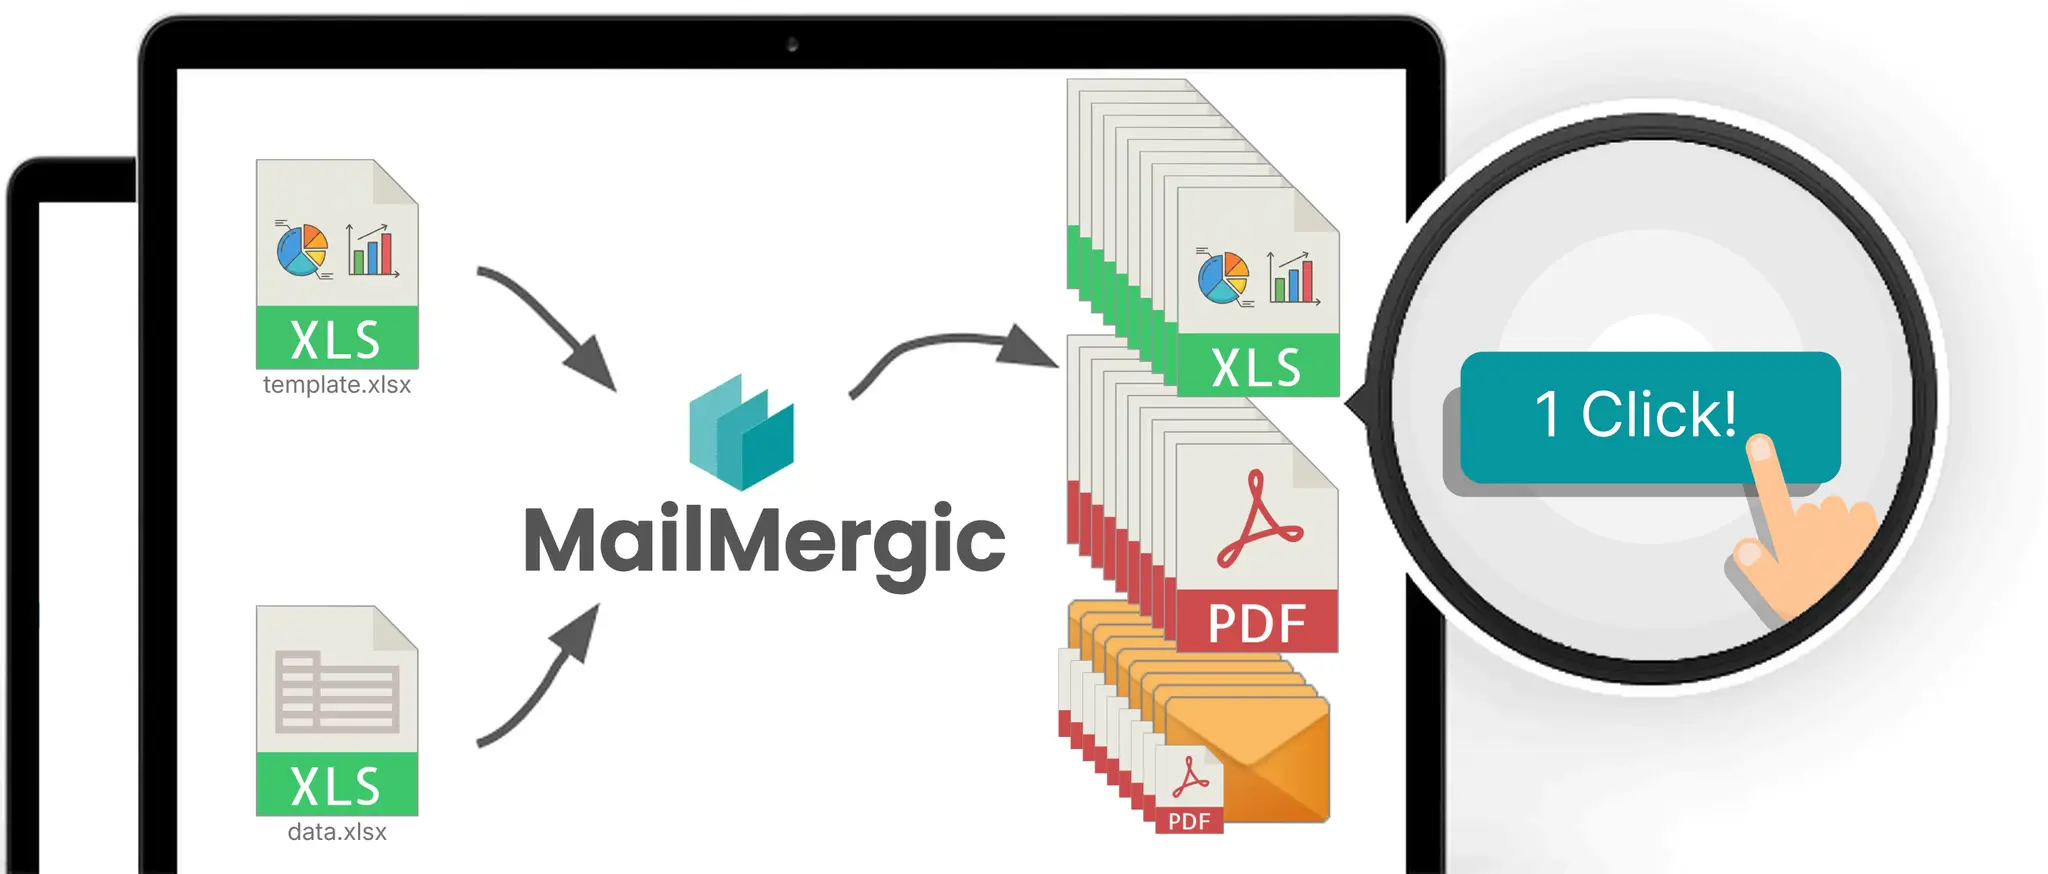
SUM, VLOOKUP, IF, INDEX/MATCH, SUMIFS, and COUNTIFS all recalculate after substitution; the full preservation list is in the foundation guide, and the formula preservation deep dive covers the full story.
The variance block: actual vs budget vs prior year
The P&L sheet’s columns per line: Actual (C), Budget (D), Var (E), Var % (F), Prior year (G), YoY (H).
E12: =C12-D12
F12: =IF($D12=0, "", ($C12-$D12)/ABS($D12))
H12: =IF($G12=0, "", ($C12-$G12)/ABS($G12))
The sign convention does the heavy lifting: store cost lines as negatives in the extract. Then favorable variance is positive on every line with no per-line logic, EBITDA is a plain SUM over the block, and one convention removes twenty-five special cases. ABS() in the denominators is the companion move; without it, a cost line’s percentage flips sign against intuition. Skip the actual/budget-1 form entirely, since it contradicts the convention on cost lines.
The IF guards are load-bearing, and two named regions prove it. Gulf Coast carries a line budgeted at zero (the product launched after budget lock), and Mountain West opened in March, so its prior-year cells are empty. Naked division fills exactly those two packs with #DIV/0! while the other ten look fine. Format Var % and YoY as percentages once in the template, and every generated file shows 12.4%, not 0.124.
Thresholds follow convention: flag variances past 5 to 10 percent with a fixed floor, for example 10 percent or 5,000, whichever is greater, and give every flagged line one commentary sentence naming driver, action, and owner. For the formatting itself, default to an icon set or color scale on the Var % column; those are documented as surviving generation. The precise version moves the threshold into a Review column beside the block: =IF(AND($D12<>0, ABS($E12)>=MAX(0.1*ABS($D12), 5000)), "REVIEW", "") filled down, with a cell-value color rule turning REVIEW red. It encodes “10 percent or 5,000, whichever is greater” directly, stays error-free on the zero-budget line, and sidesteps a real limit: formula-based paint rules are not on the documented preservation list, so the formula computes a value and the color rule only reads it. The payoff: the identical formula ships in all twelve packs and flags different rows in each, so Great Lakes’ unfavorable freight line comes out red in Great Lakes’ file only.
Three sheets per region: summary, P&L, commentary
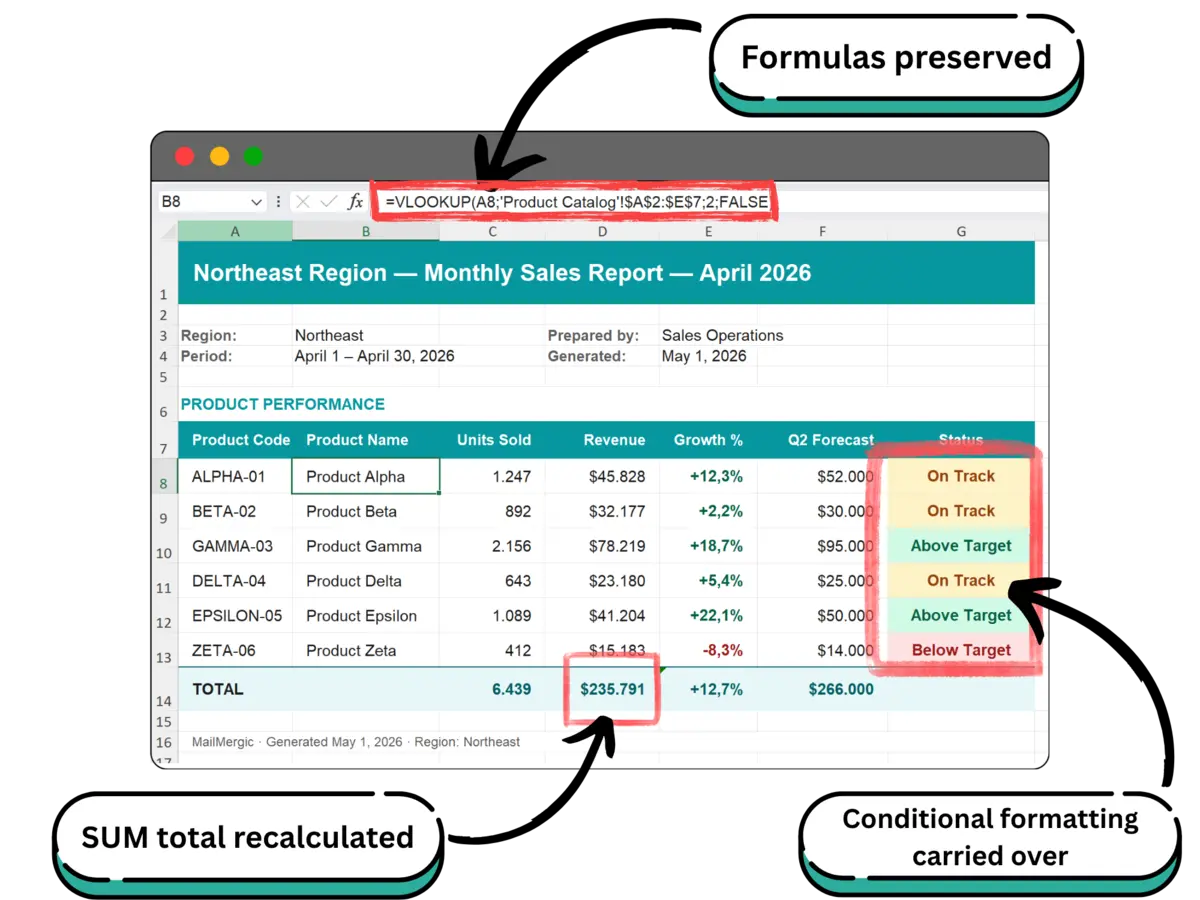
The Summary sheet is the scorecard, 3 to 7 metrics by convention. This build uses five: revenue, EBITDA, variance to budget in dollars and in percent, and YoY growth. Each is either the same region-key SUMIFS or a plain reference like ='P&L'!C36. The Commentary sheet receives @commentary as a whole-cell placeholder, @manager_name in the greeting line, and @period on the cover. The flux narrative becomes a data column instead of twelve pasted paragraphs.
Set the page setup per sheet for the PDF run: Summary portrait, P&L landscape, print areas from the Print Settings ribbon tab so each sheet paginates as designed.
Finally, right-click the Data and Regions tabs and exclude them from the output. Excluded sheets stay in your workbook and are not rendered. What that means for the file the VP receives is the subject of the next two sections.
Preview the regions that break the pack
Do not preview only row 1. Row 1 is usually the region everything was designed around. Step the floating “Row N of M” pill to the four regions that break packs:
- Mountain West (opened in March): the YoY column must show blank, not #DIV/0!.
- Gulf Coast (the zero-budget line): the Var % guard must hold.
- Pacific Northwest (longest region name): the cover title and the filename must survive it.
- Great Lakes (the biggest unfavorable variance): the REVIEW flag and its red rule must actually fire, because a rule that never fires looks identical to a rule that broke.
Then there is the zero that lies. SUMIFS returns 0 both when a region truly booked nothing and when the extract silently dropped its rows, and in a close pack those are very different problems. The tripwire: a check cell on the Data sheet, =COUNTIFS($A$2:$A$400, 'P&L'!$B$2), which should match your line count, 25 in this build, for every region. It recalculates per row like everything else, so glance at it in the editor while stepping the preview. A region counting 21 means the extract lost rows, caught before a VP finds the hole for you. And because Data stays home in the scoped runs, the tripwire never reaches anyone outside finance.
Close with the one-row test: generate one region’s file and open it. In about a minute it answers whether anything renders as #NAME? or #VALUE!, whether the formula rule landed, and, decisive for the next section, exactly what a recipient’s copy computes when Data is excluded. Macros are stripped on upload (.xlsm keeps its extension, the code comes out empty), so if any pack math lives in VBA today, move it into template formulas first.
Who gets the workbook, who gets the PDF
Back to the Northeast VP. The answer is not yes or no. It is which run their name is in, because the pack ships in two runs from one template.
PDF goes to the wide list: the VPs who read, print, and forward. Threshold formatting renders as designed, per-sheet print areas paginate each sheet, a password can be applied to every file, and PDF sidesteps the excluded-sheet question entirely, because nothing in a PDF computes.
The workbook goes to recipients who genuinely model. Each output is a clean Excel file with formulas intact, ready for the recipient to drill into. Formulas intact is the exact promise, no more. Here is the honest split behind it. Include the Data sheet, and the VP can trace the freight line down to extract rows, and can also read the other eleven regions, because the extract holds all regions. Never do that for scoped recipients. Exclude Data, and the file is scoped by construction.
What a SUMIFS that pointed at the excluded Data sheet shows in the recipient’s copy is not something to assume from an article, this one included. Run the one-row test, open the file exactly as the Northeast VP will, and read the formula bar. About a minute, and you know precisely what you are shipping.
The practical middle ground: the more line-level granularity you build into the P&L sheet itself, the less anyone needs the raw extract. Depth of drill-down becomes a template decision instead of a disclosure decision. Freight is the worked example: split it into its extract lines (carrier, fuel surcharge, accessorials) as P&L rows pulled by the same key, and the question under the freight number gets answered inside the scoped file, before the reply-all asks it.
Internal copies are the easy cases. Group FP&A and the CFO already see every region, so their copies can keep Data, and the combined single PDF option (PDF only; .xlsx is always one file per row) makes the flip-through book for the CFO. The archive copy at close is the frozen-snapshot argument the decision guide owns.
| Recipient | What they do with the pack | Ship | Data sheet in the file |
|---|---|---|---|
| Regional VP, wide list | Reads, prints, forwards | PDF, optional password | No |
| VP who models on the numbers | Rebuilds, extends, interrogates | .xlsx, scoped | No, and run the one-row test first |
| Group FP&A and the CFO | See every region anyway | .xlsx, or one combined PDF as the internal book | May stay in, internal only |
| The archive at close | Frozen record of what was reported | PDF or .xlsx snapshot, filed not sent | Your call, it never leaves finance |
PDF to the wide list. A scoped workbook to the modelers. The full Data sheet to no one outside the consolidation team.
The pricing sheet build made the same format call for customer-facing sheets. Finance adds the twist that the recipient is internal and still must not see peer regions.
Out the door by working day five
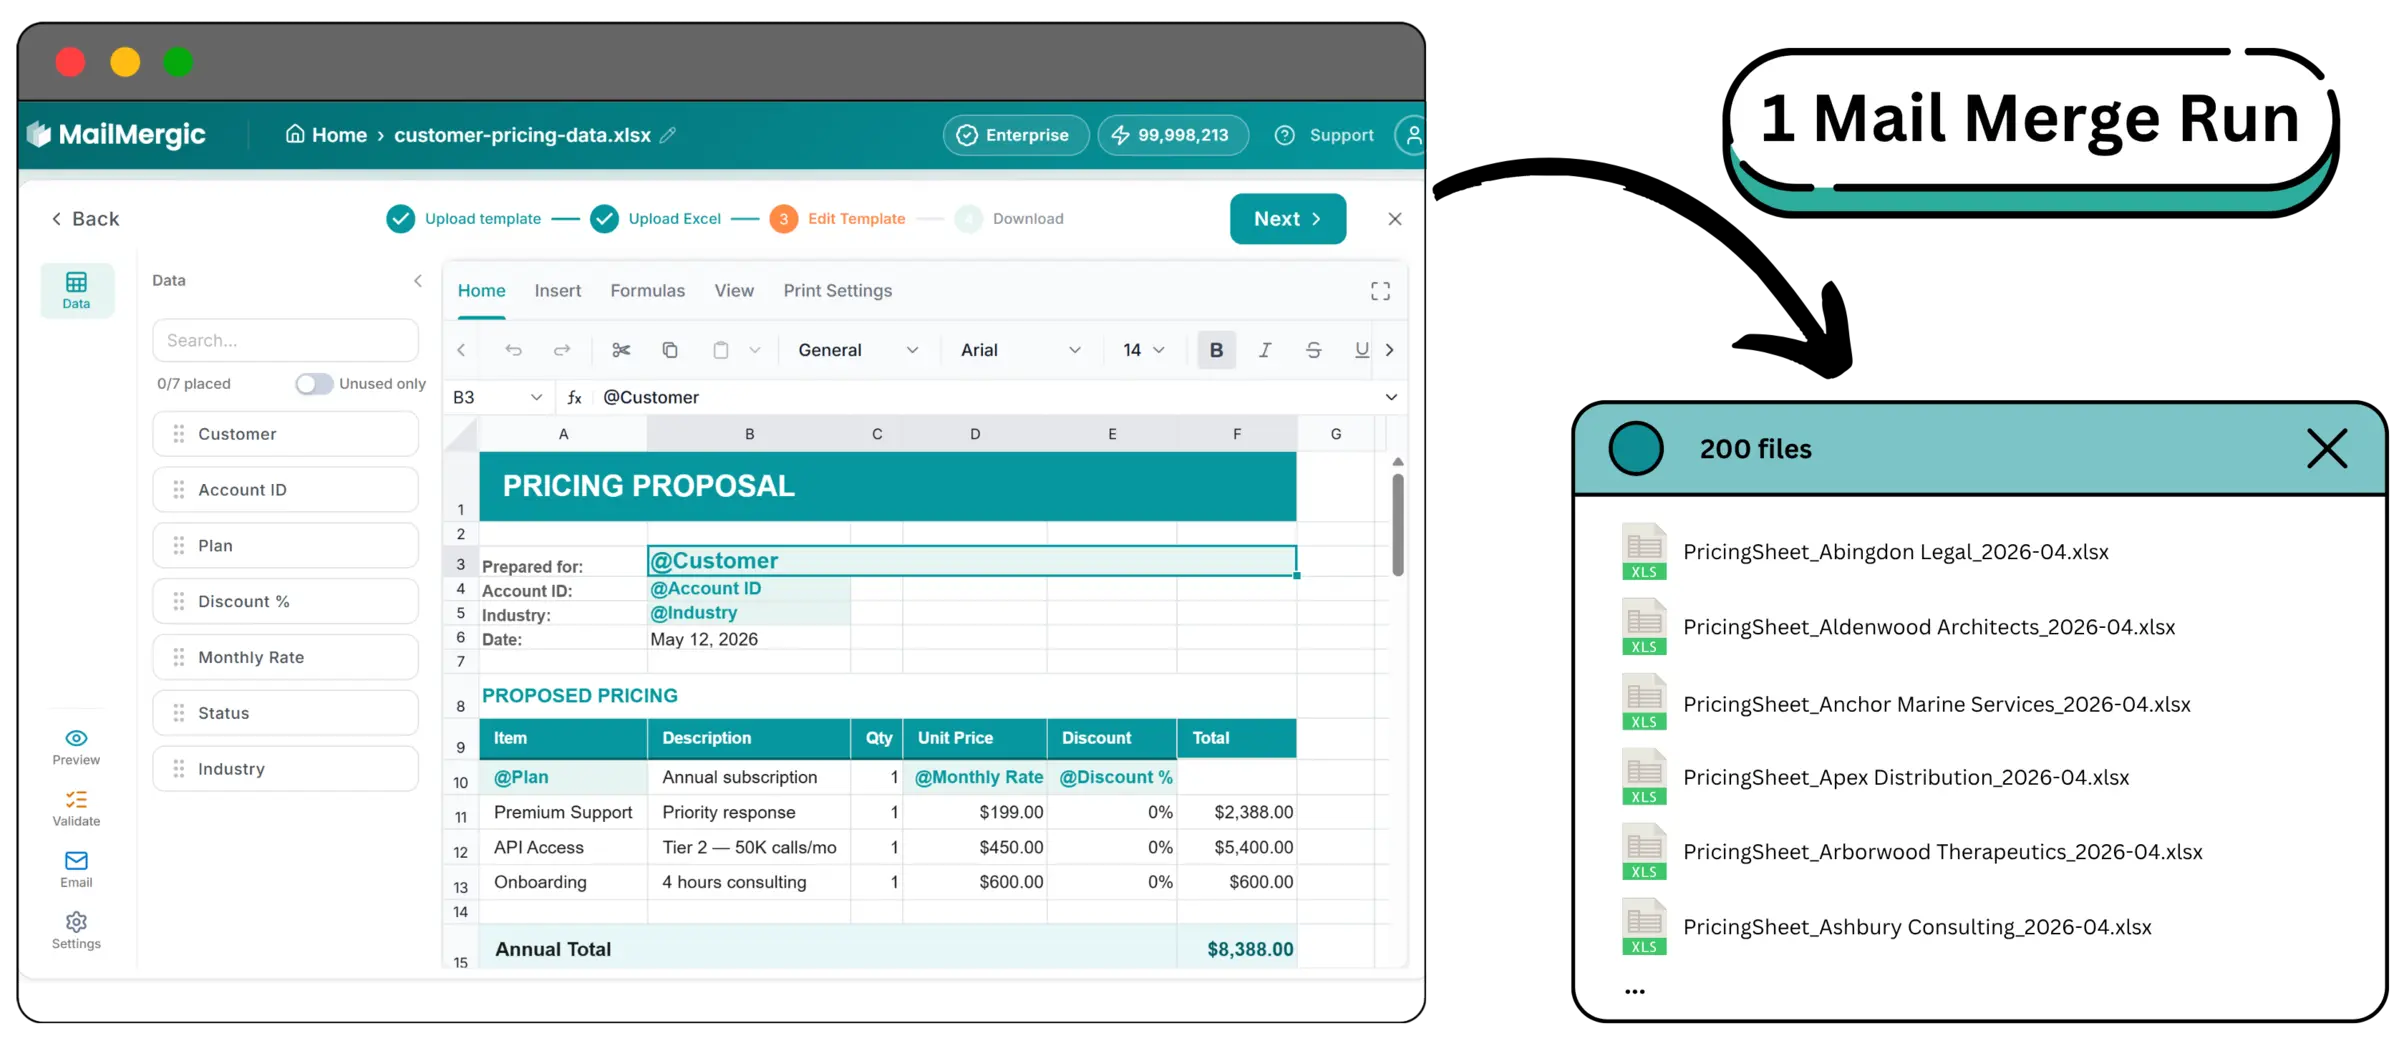
The filename pattern pulls its keys from the row: Pack_@period_@region_code_@region_name.xlsx becomes Pack_2026-07_NE_Northeast.xlsx. Because @period is a data column landing in the cover title and the filename, the file names its own month, the folder sorts itself by period, and the which-version-is-final debate ends: regeneration replaces resending. The monthly re-date is one fill-down in the period column; titles and filenames move together, and nothing is retyped in the template.
Two runs, one configuration: run once as PDF for the wide list, toggle the format, run again as .xlsx for the modelers. The configuration persists between runs, so the second pass is one click. Twelve rows in, twelve packs out, downloaded as a ZIP.
The recipient column is manager_email, the subject carries merge fields (@region_name month-end pack, @period actuals), and the body greets @manager_name. The subject re-dates itself with the same fill-down as the filename. The attachment comes from the same row that built the file, so nobody picks one file out of twelve by hand on a close-week morning. Delivery, opens, and bounces land per recipient in a dashboard: you know the pack reached the new Southeast manager before the review call, and a bounced address surfaces on day one instead of at the QBR. Own-domain sending is a paid-plan feature. Generation also makes most of the pre-send checklist true by construction.
The close math: call it a full afternoon for the manual loop across twelve packs, and call it 1 to 2 hours for the real first-month cost, the template work. The first mail merge run takes about five minutes; every close after, about a minute. The foundation guide’s claim for this exact use case holds verbatim: half a day becomes a 10-minute setup the first month and a one-minute re-run.
Housekeeping: 12 rows is 12 credits per run, and the free plan’s monthly credits cover a real test of the pack (pricing). The 25 MB and 100,000-row limits are nowhere in sight for a 300-row extract. Files are processed in EU data centers and encrypted in transit and at rest; MailMergic is GDPR and CCPA compliant, files are not used for AI training, and retention is configurable from 1 to 180 days (privacy).
The close week checklist
- Working days 1 and 2: nothing. The template is finished work from last month. Resist improving it mid-close.
- Working day 3: consolidation goes final. Paste the new extract into Data. Update the period column. Confirm the header banner picked the right row. If the Regions row source lives in a connected Google Sheet, reselect it; it is a snapshot from connect time. Write the twelve commentary cells while the variances are fresh.
- Working day 4, early: generate and send. Glance at the tripwire. Step the four hard-case previews. Run the one-row test on the biggest mover. Generate both runs, spot-check two files from the ZIP, send.
- Working day 4, later: the receipts. Check the delivery dashboard and chase the bounce if there is one. Drop the ZIP into the close binder as the frozen record of what was reported to whom.
- Working day 5: the buffer day the manual loop never had. Reforecast questions arrive against files whose logic the VPs can trace, which shortens the answers.
That afternoon of copy-paste becomes the checklist above, and the checklist’s longest line item is writing the commentary. Which was always the real job.
Frequently asked questions
Q: How do I create a monthly report for each region from one Excel workbook?
A: Keep a row source with one row per region and a template whose key cell holds @region_name. Every SUMIFS references that cell, so each generated pack recalculates for its own region. The row carries only the key and the routing; the extract can change row count monthly without the template changing shape. Twelve rows produce twelve packs; the first run takes about five minutes.
Q: How do I split one Excel workbook into a separate file for each region without VBA?
A: The pivot trick (Show Report Filter Pages) makes sheets inside the same workbook, not separate files, and macros need a maintainer (the no-VBA guide covers that trade). A template plus a row source generates separate, scoped files instead: one per region row.
Q: How do I send each branch manager only their own region’s numbers?
A: Generate each file from that region’s row with the extract sheet excluded, so no other region’s data was ever in the file. The email step pulls the address from the same row, and delivery and bounces are tracked per recipient.
Q: What should a month-end reporting pack include?
A: Convention says a headline scorecard of 3 to 7 metrics, the P&L with budget vs actual variance, and written commentary on material variances. The three-sheet template maps onto exactly that: Summary, P&L, Commentary.
Q: How do I calculate budget vs actual variance in Excel?
A: Variance is =actual-budget; the percentage needs a guard and an absolute denominator: =IF(budget=0, "", (actual-budget)/ABS(budget)). Store cost lines as negatives and favorable variance is positive on every line, with no per-line logic.
Q: What variance threshold should trigger written commentary?
A: Common practice flags variances past 5 to 10 percent with a fixed floor, for example 10 percent or 5,000, whichever is greater. Mirror the same threshold in the formatting rule, so every flagged line and every commentary sentence agree.
Q: Should regional managers get a PDF or an Excel file?
A: Decide per recipient, not per pack. PDF for the wide list that reads and forwards; a scoped workbook for the managers who genuinely model on the numbers. The distribution matrix above maps the four common cases.
Q: Can recipients see other regions’ data in the generated file?
A: Not if the file was generated from their row with the Data sheet excluded, because the other regions’ rows were never in it. Hiding is not scoping, and a full extract must never ship to scoped recipients. For what their copy’s formulas display, run the one-row test and look.
Q: Can I schedule the pack to go out automatically every month?
A: There is no timer. The configuration persists, so the monthly cycle is: paste the new extract, update the period column, re-run in about a minute, and sending is one click. If unattended scheduling is a hard requirement, a workflow platform is the honest answer, monitoring burden included.
Q: Does conditional formatting survive in every generated report?
A: Color scales, data bars, and icon sets are the documented types that carry through, along with cell-value rules. Formula-based paint rules generally do not; rebuild a threshold as a computed flag cell with a cell-value color rule reading it, like this article’s Review column. The preservation list has the full details.
One close, twelve packs, one run
The Northeast VP gets an answer that respects both sides of the desk: drill-down becomes a per-audience decision the build makes cheap, not a fight the team refights each close. One workbook, a region key in one cell, twelve packs in about a minute per re-run. The first run takes about five minutes on the free plan with your own extract.
New to the mechanism? Start with the complete guide. Weighing tool classes? Read the decision guide. Replacing the macro? The no-VBA guide walks the migration. Building the customer-facing variant? See the pricing sheet build. The per-employee summaries walkthrough and the rent roll walkthrough are live, and the formula preservation deep dive completes the series.

Upload XLSX · Get XLSX or PDF